Problem: How does yeast impact pressure and acid & base levels?
Hypothesis: When the yeast is added, the pressure level will rise, and the acid and base levels will skyrocket.
Materials: 1 computer
1 Vernier computer interface
1 Vernier Gas Pressure Sensor
1-hole stopper assembly
10 mL graduated cylinder
3% hydrogen peroxide
Yeast suspension
3 test tubes
1 test tube rack
1 eye dropper
3 mL of acidic mixture (diet soft drink, preferably coca cola)
3 mL of neutral mixture (skim milk)
3 mL of basic mixture (stomach antacid)
3 sticky notes (with a writing utensil)
1 250 mL beaker
20 mL of tap water
1/2 teaspoon of yeast
1 teaspoon

Procedures:
1) Obtain all washed and dried materials on a solid, level surface. It is strongly suggested to wear goggles for safety, but it is not required.
2) Connect the black stopper to the gas pressure sensor, which will then be attached to the computer interface. Open Logger Lite from the Vernier data-collection program and search the computer for a file labeled “24 Yeast Beasts” from the Middle School Science with Vernier folder.
3) Obtain 3 test tubes and a test tube rack for sturdiness. With sticky notes, label each clean tubes with A, N, and B (for acid, neutral, and base), assigning one letter to each tube. This will annihilate any future confusion as to which one is which.
4) Add 3 mL of hydrogen peroxide to each tube, carefully measuring and analyzing each measurement at a level height to receive the most accurate results.
Add 3 mL of each mixture to its test tube.
Using a 250 mL beaker, measure 20 mL of water and add one half tsp of yeast to the mixture. Stir with the teaspoon until properly blended.
7) Add 2 eye dropper units of the yeast and water mixture into Test Tube A.
8) Insert the black rubber stopper into the test tube.
9) Vigorously twist the stopper on to fasten for an airtight fit.
10) Click the collect button to begin data collection. Note: It is vital to keep pressure on the top of the stopper while the yeast takes effect in the test tube.
11) Test the data and record he highest pressure and at what time that it was documented. Do not disturb the contents of the tubes or computer until the data is collected.
12) Repeat steps 6-11 until all three tests are completed.
13) Save all information and disconnect all tubing and cords only to return them to their original compartments.
14) Make diagrams of the experiment.
Results and Conclusion:

The above table displays how much of the 3% hydrogen peroxide solvent and quantities of the mixture (whether it be diet coca cola, skim milk, or stomach antacid) is combined while in their test tube containers. For visual purposes, the chart also marks the letter with its corresponding material (in this case, an acid, neutral, or base). In this experiment, 3% hydrogen peroxide was tested with each type of acid/base. In Test Tube A, diet Coca Cola was integrated with the H2O2 (3% hydrogen peroxide) solvent. Once the yeast solution was fabricated and 2 eye drop units were added to the cylinder of glass, the black rubber stopper (connected to the Vernier Logger Lite Software) was firmly fitted on the opening of the tube to produce an airtight, secure seal. However, pressure was still needed to be placed on the top in order to restrain the cap from popping off. Although the procedure was to remain until the two minute mark, internal pressure prevented that from being the case, consequentially shortening the testing period. At the 1.4 second indicator, the pressure from the yeast mixture combining with the peroxide and soft drink spiked at 137.86 kPa (pressure). Oddly enough, the chart shown on the computer interface displayed an odd dip at the beginning of the trial. This could have been representing the fact that more pressure needed to be placed at the top of the rubber stopper by making a significant note that a slight bit of air was being released at the top. This was immediately recovered, and the test resumed, allowing the pressure to make somewhat of a highly arched outline of the Vernier graph. The physical aspect, according to the naked eye, of the process came to a close when there were two distinct layers: one of pure coca cola solution and one of trapped gas in the soda’s bubbles. To sum the soda trial up, it was the experiment that produced the lowest yeast activity, according to pressure measurements, but the highest level of liquids/gases out of the three.

The neutral element in this experiment was the mixture of the yeast and water solution, 3% hydrogen peroxide, and 3 mL of skim milk. This too recorded results of a significant dip. Nonetheless, there was a sensible explanation of this occurrence which was described as the transfer of the rubber stopper; the stopper needed time to adapt to its new position and change in weight and pressure (from both the interior and exterior). Yet another variable that could have contributed to different results would be that the eye dropper was not exactly the most accurate measuring unit due to it inability to be completely consistent in its content dimensions. This physical reaction caused the two separate echelons (as described above) to become slightly less distinct due to its clear merging colors.

The last Test Tube contained the base and utilized the reaction between the stomach antacid, 3% hydrogen peroxide, and yeast and water solution to produce a final product with a very distinct layer of bubbles. This stratum could quite possibly be classified as taller than the liquid that it was buoyantly levitating upon (the solution). What was first thought out to be a potential candidate for the lowest activity of yeast pivoted to be the greatest activity, pressure measurement-wise, at least. It proved as a great success with a pressure peak of 173.05 kPa.

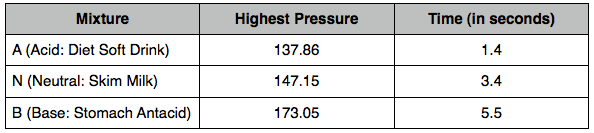
From this, we can conclude that, because antacids work directly as a medicine that controls the pH balance in a human being and stifles the pain of heartburn, it had the most effect as far as pressure goes because it was working as it would if swallowed. On the other hand, the amount of artificial sugar in the Coca Cola produced a large quantity of bubbles along with its high level of carbonation. In total, the experiment had a favorable outcome.

No comments:
Post a Comment